Relationship charts
Represent people, entities, accounts and documents; organise groups and explore case connections.
 Yappari
Yappari’s capabilities combine according to the analytical objective. The chart, timeline, map and documentation are part of one workspace.
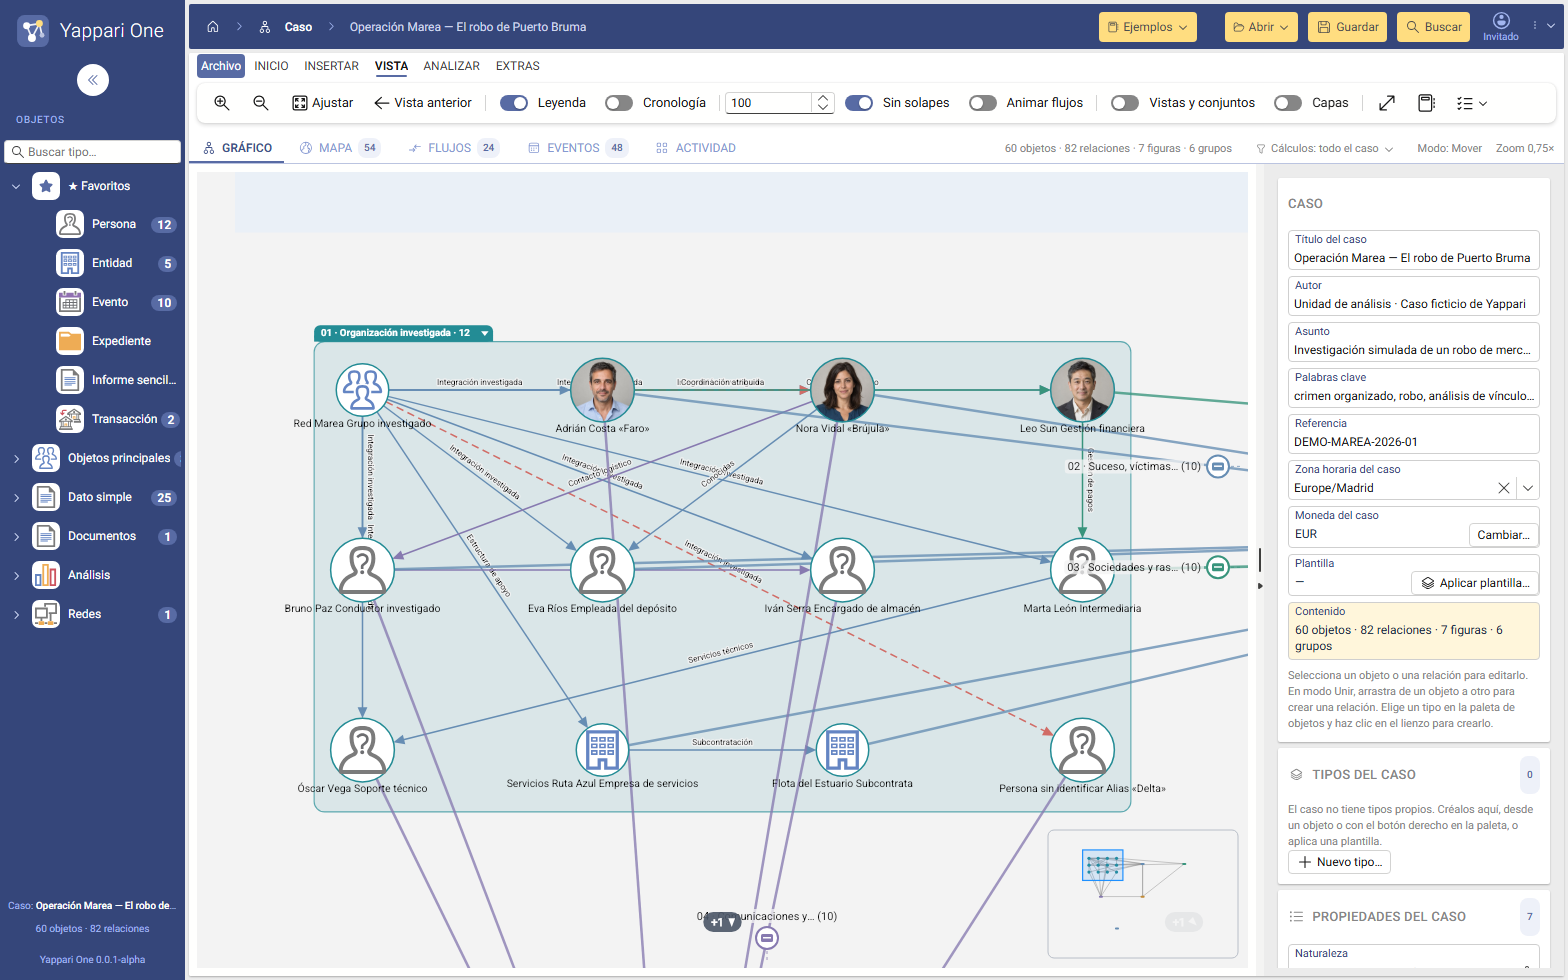
Represent people, entities, accounts and documents; organise groups and explore case connections.
Connect financial movements and communications to the entities involved.
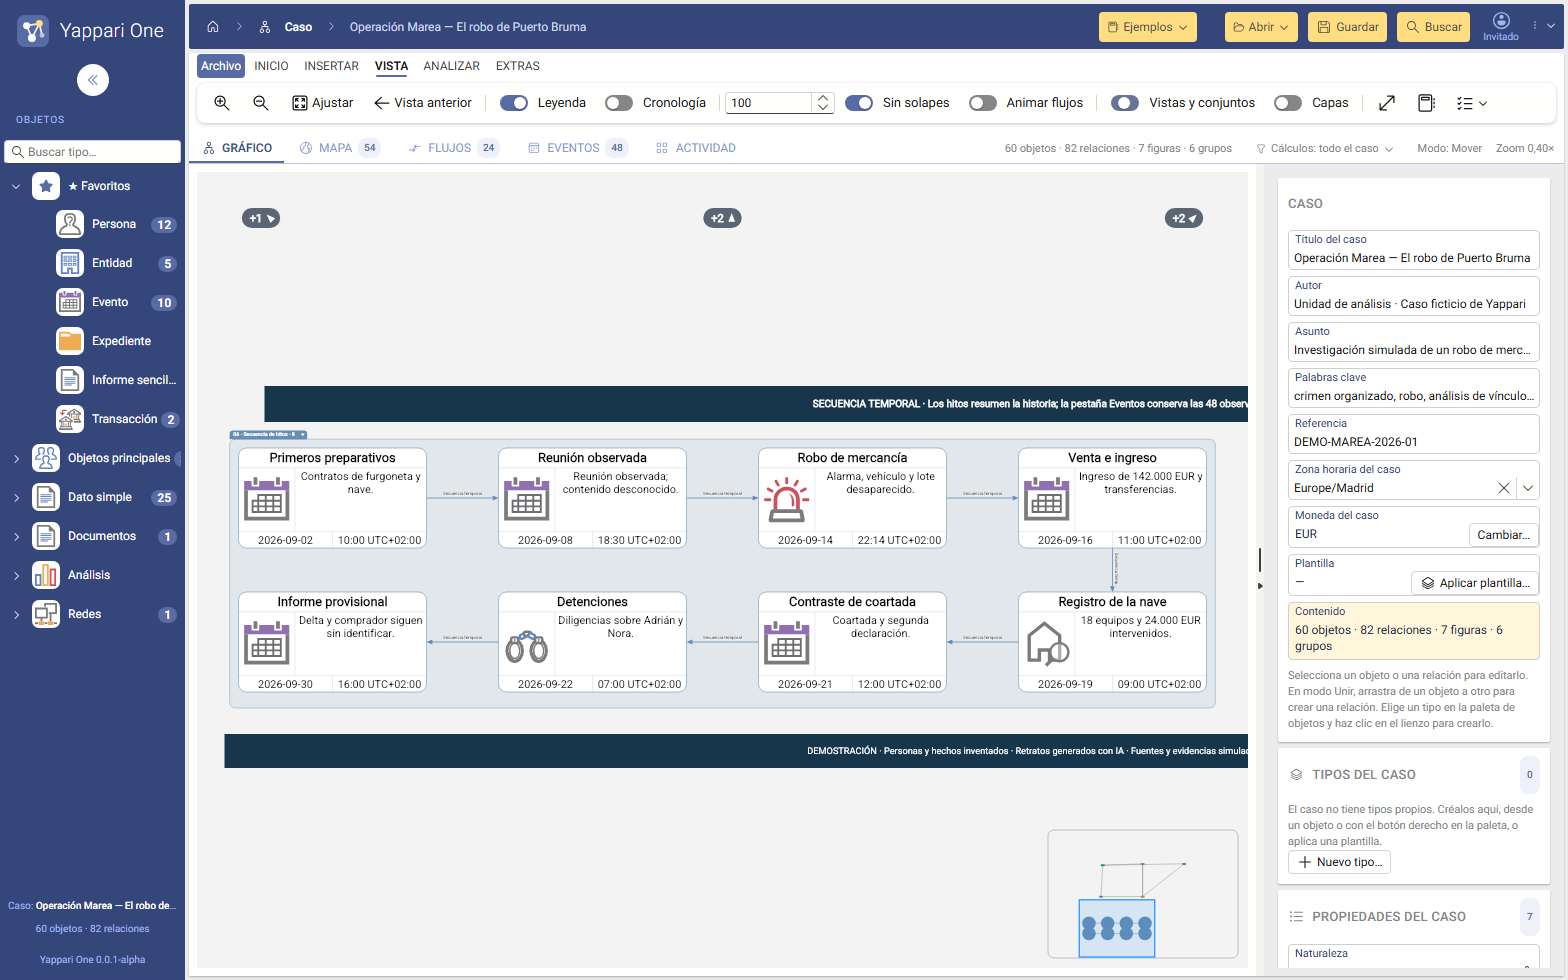
Order facts by date and examine their sequences and intervals.
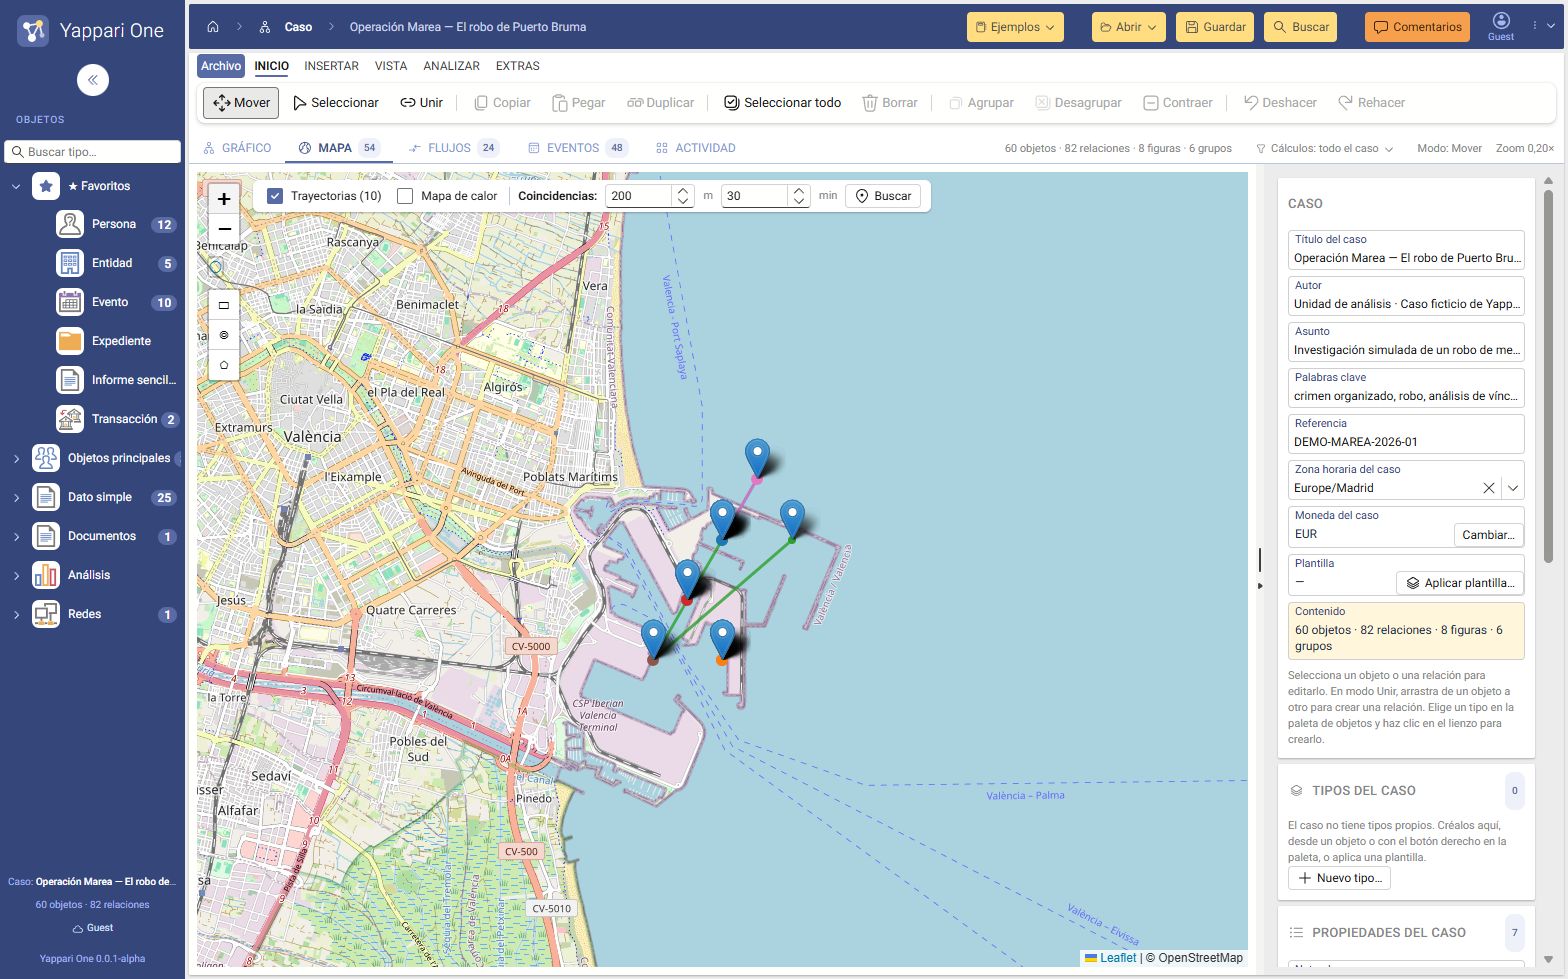
Place locations, events and trajectories in their spatial context.
Associate documentation and sources with relevant case elements.
Save case perspectives, add annotations and prepare a visual explanation of the analysis.
Yappari provides an MCP (Model Context Protocol) connection between the browser application and agentic tools, bringing visual analysis into your agent-assisted workflows.
It is Yappari’s web application for link analysis and case building. It supports entities, relationships, events, transactions and documentation.
Yes. Open the application and use the examples menu to explore its different perspectives. Fictional data helps you get to know the tool.
Yappari One is in its alpha phase and continues to evolve. The application identifies this stage of development.
The tool helps organise and visualise information. Source assessment, relationship interpretation and conclusions remain the professional’s responsibility.
If you have a question about Yappari or its application to your professional context, you can write to us.

